Getting Started
Logging In
Navigate to your organization's GRC-ITSM agent application and sign in with your credentials. If your instance is configured with SSO, you'll also have the option to sign in using your organization's identity provider.
Agent Dashboard
After logging in, you'll land on the agent home page, a dashboard of the system's compliance posture and your team's workload.
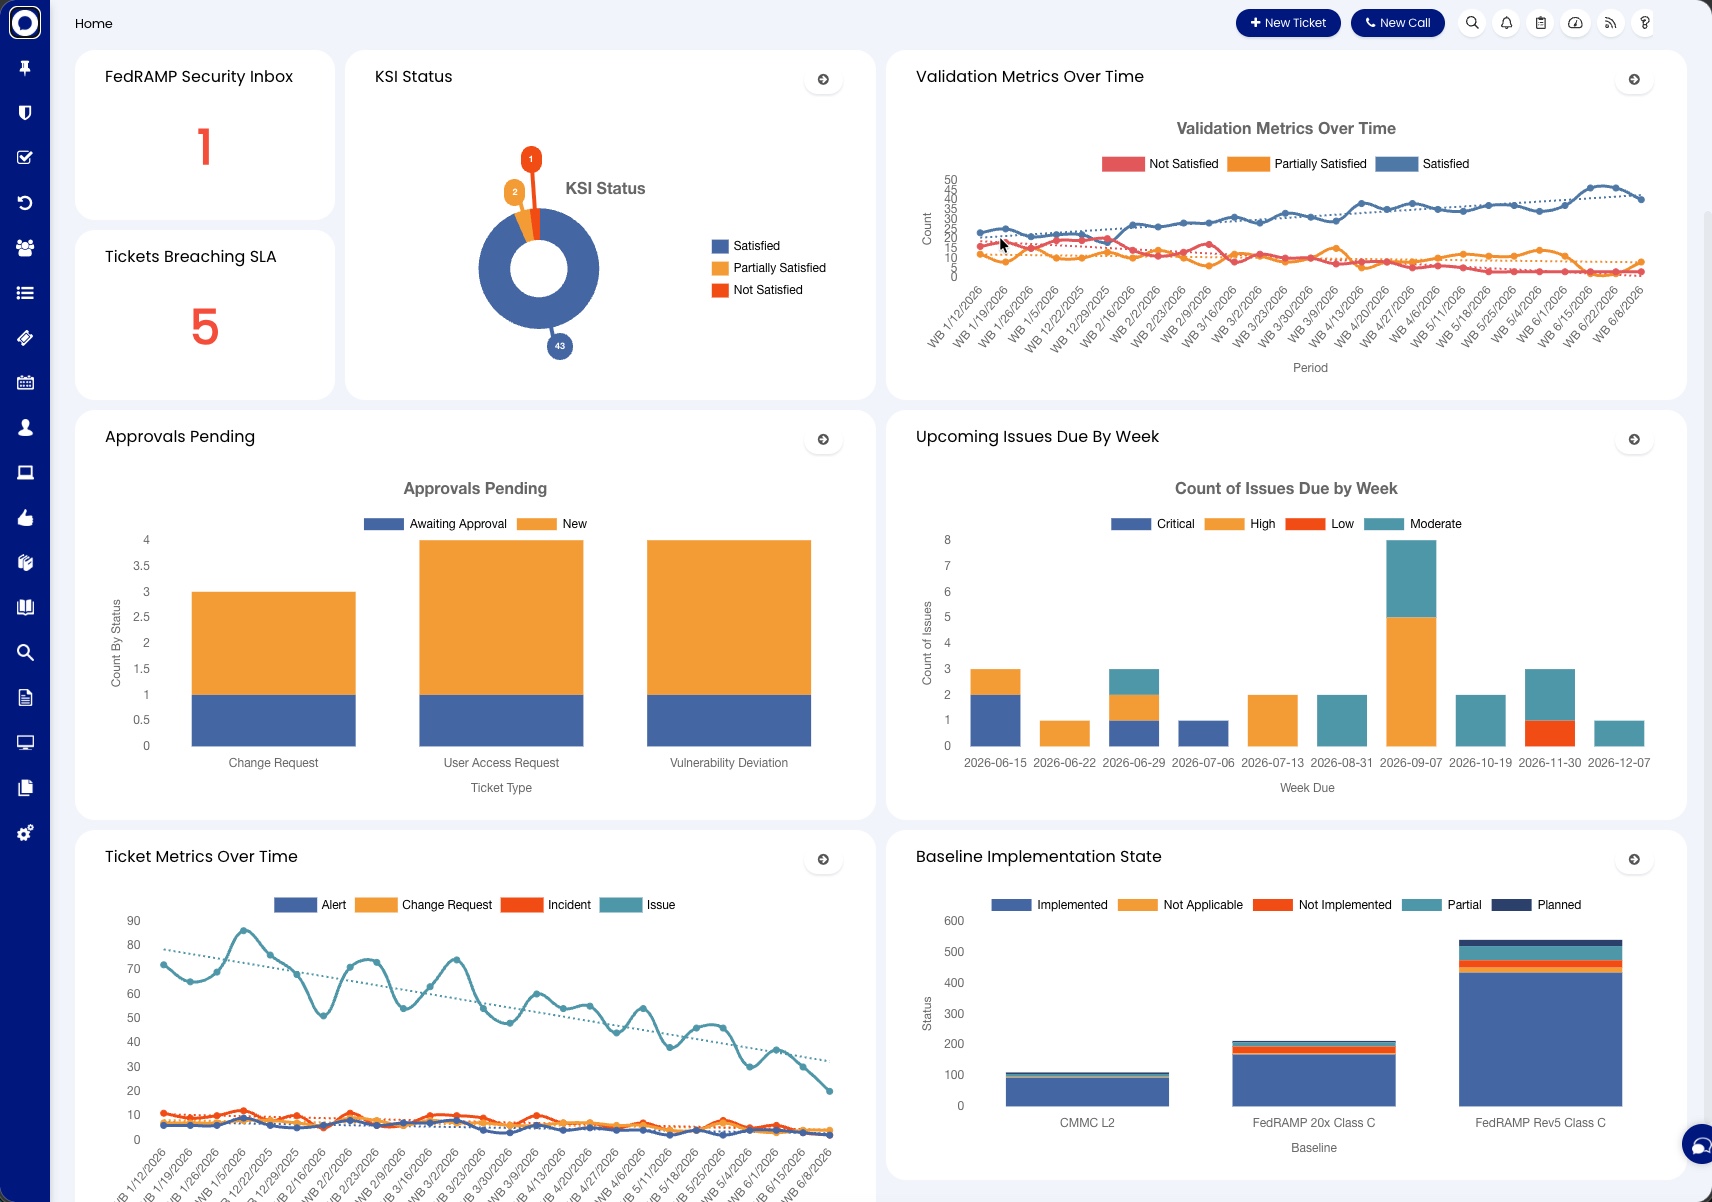
The default dashboard widgets:
| Widget | What it shows |
|---|---|
| FedRAMP Security Inbox | Unactioned messages in the FedRAMP Security Inbox -- anything here has a response clock running |
| Tickets Breaching SLA | Count of tickets past their SLA targets, your first triage stop |
| KSI Status | Satisfied / Partially Satisfied / Not Satisfied counts across Key Security Indicators |
| Validation Metrics Over Time | Weekly trend of validation outcomes |
| Approvals Pending | Pending approvals by ticket type (Change Requests, User Access Requests, Vulnerability Deviations) |
| Upcoming Issues Due By Week | Remediation due dates by severity across coming weeks |
| Ticket Metrics Over Time | Open Alert / Change Request / Incident / Issue volumes over time |
| Baseline Implementation State | Implementation status per authorized baseline (e.g. CMMC L2, FedRAMP 20x Class C, FedRAMP Rev5 Class C) |
Dashboards are configurable per agent; your instance may show a different widget set.